Overview
This page provides a walkthrough for new users who want to extract tables from PDFs. For more detailed reference material, see the Text Controls and Layout Controls pages.
Example: Simple Table
In this example, we will extract a single table from an Amazon 8K filing. This table is simple, so extracting the data only takes a few steps.
Step 1: Upload Document, Create Text Layer
Start by uploading your document. Documents may either be (1) a single PDF file or (2) a series of PNG or JPEG images containing scanned pages.
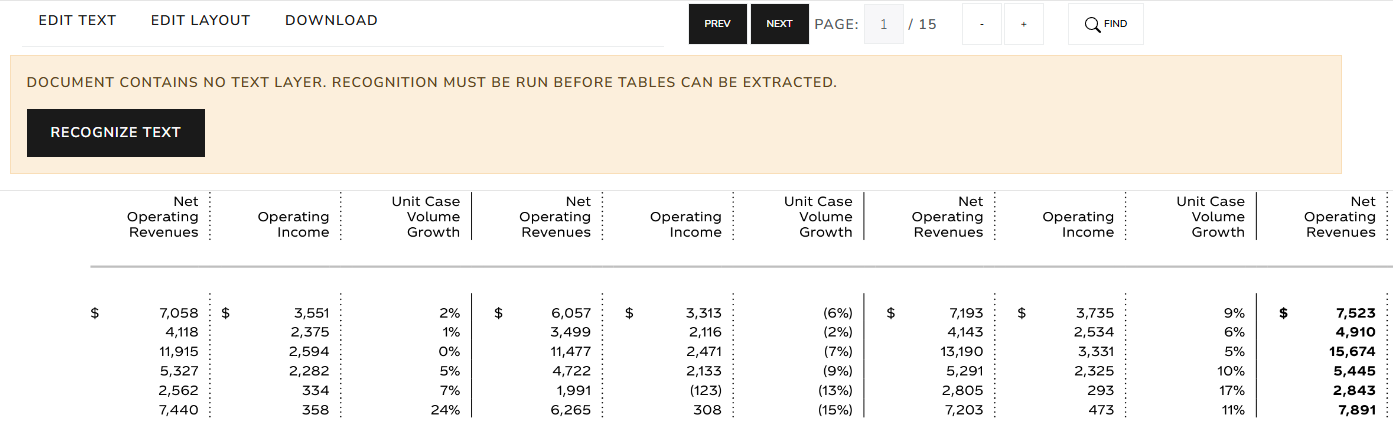
If the document uploaded is a series of images or an image-native PDF, you will be prompted to click Recognize Text to run OCR and recognize text. This step is optional when uploading an image-native PDF document that already contains PDF data, and is skipped entirely for text-native PDF documents.
Step 2: Proofread Text Layer
If text recognition was suggested or required during the import step, the input is image-native rather than text-native. This means the text layer may contain errors. If accuracy is critical for your application, you should review the text layer and correct any errors before proceeding. If text recognition was not suggested during the import step, the input is a text-native PDF, and this step can be skipped.
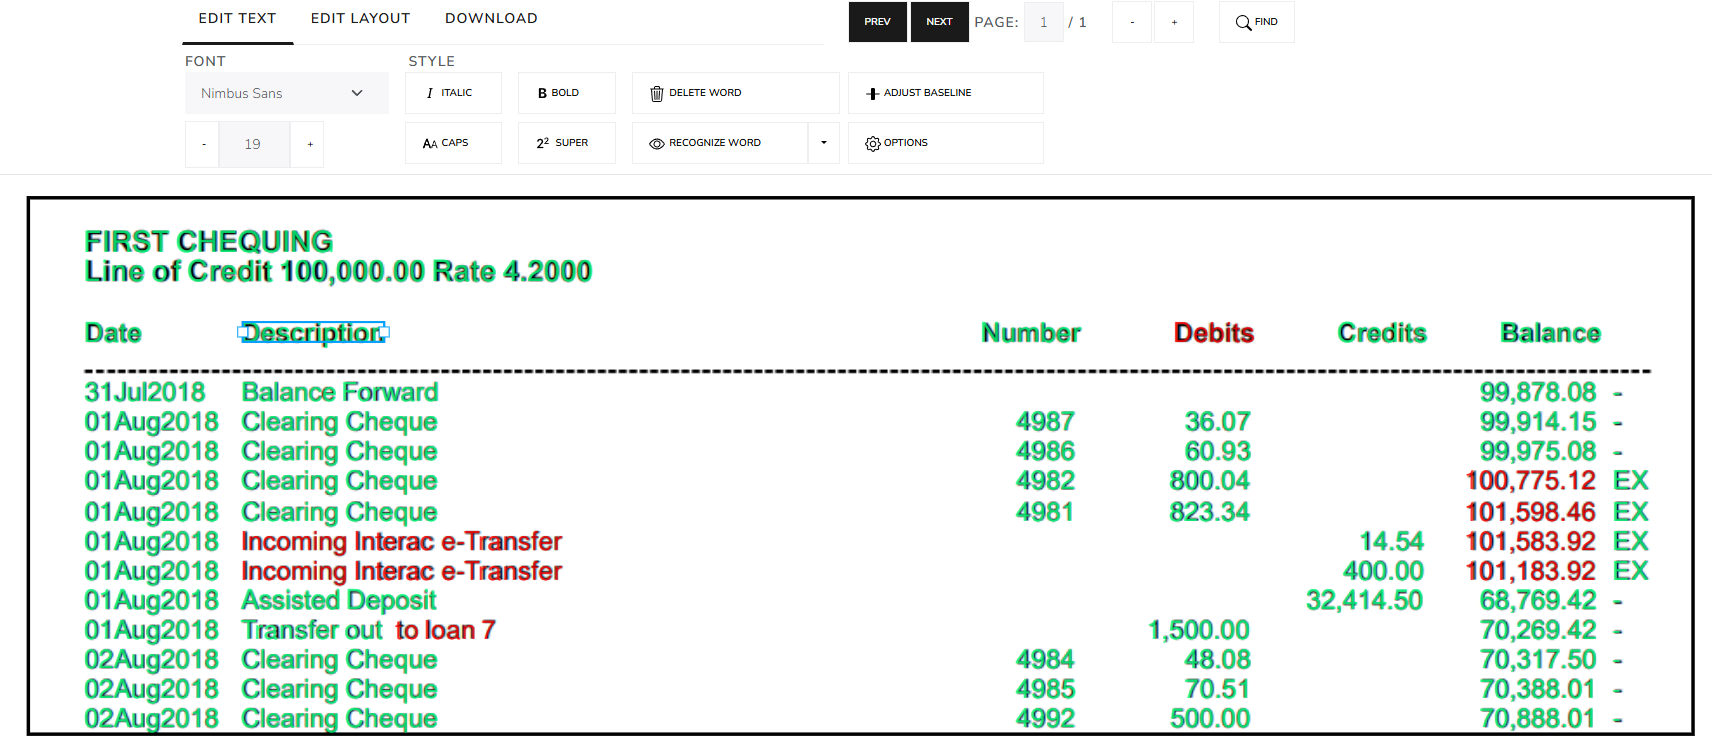
To proofread the text layer, open the Edit Text tab. Text is not editable when the Edit Layout tab is open. Next, review the colored text layer that is printed over the document. Special attention should be paid to text printed in red, as this was flagged as low-confidence by the built-in recognition program.
Basic controls for editing are listed below.
- Edit text by double-clicking a word to enable editing.
- Delete text by selecting word(s), right clicking, and selecting
Delete Words. - Recognize additional words by clicking
Edit Text>Recognize Wordand then selecting the area around the word.- Select
Edit Text>Recognize Areaif the region contains multiple words.
- Select
A full list of controls can be found on the Text Controls page.
Step 3: Add Table Layout
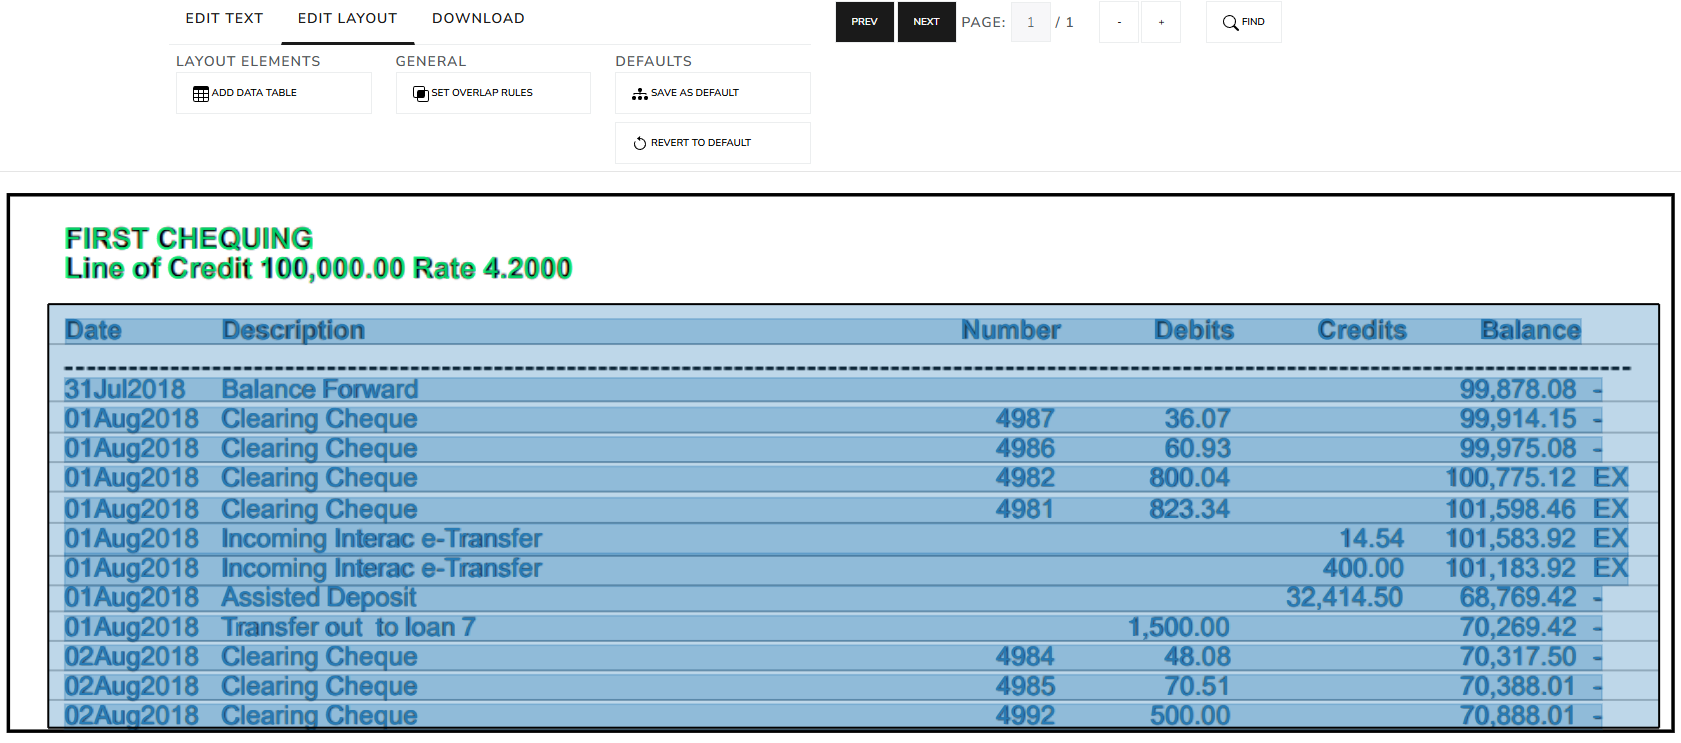
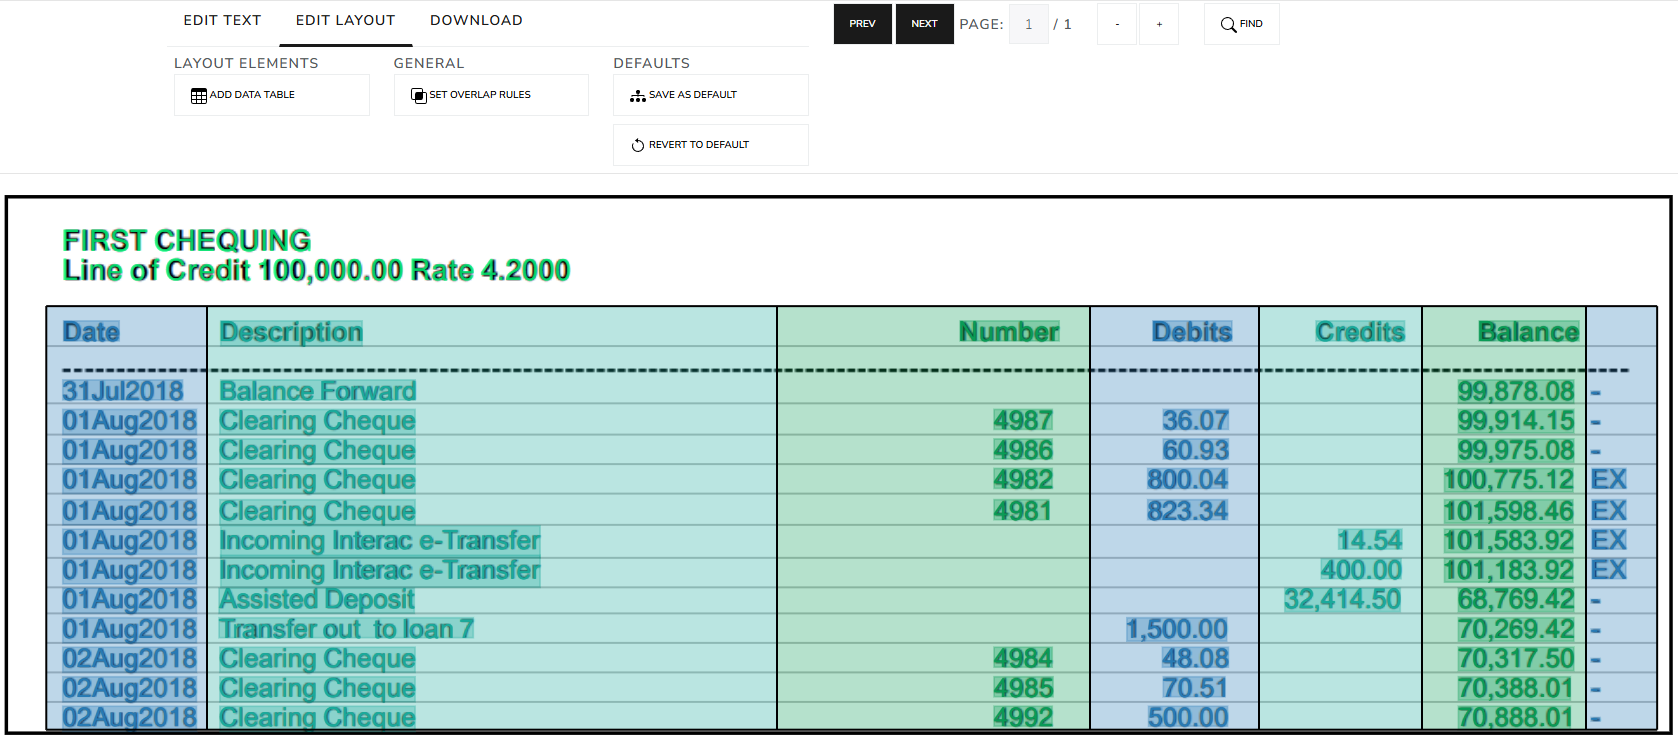
Once a high-quality text layer exists, tables can be identified and extracted. Open the Edit Layout tab to add new tables. After identifying a table in the document, select Edit Layout > Add Data Table and drawing a rectangle over the entire table. The table is represented by a colored rectangle, with different shades representing different columns.
Next, edit the table layout until the column bounds are correct. Basic controls for editing a table layout are listed below.
- Split a column by right clicking where it should be split and selecting
Split Column. - Combine multiple columns by selecting both, right clicking, and selecting
Merge Columns. - Resize the table and columns by clicking and dragging the table or column bounds.
A full list of controls can be found on the Text Controls page.
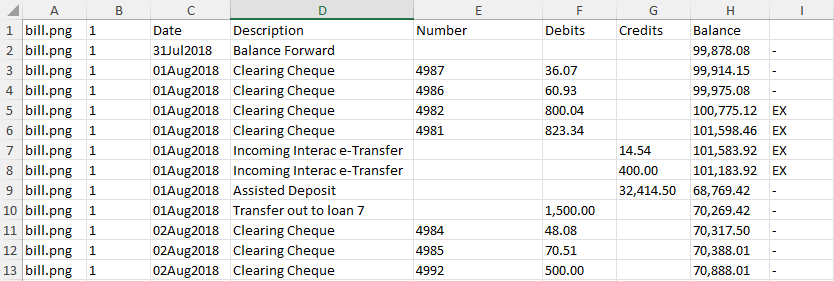
Step 4: Export
Select Download > Download to export the tables identified in previous steps as a .xlsx workbook.
Common Special Cases
Values that Span Multiple Columns
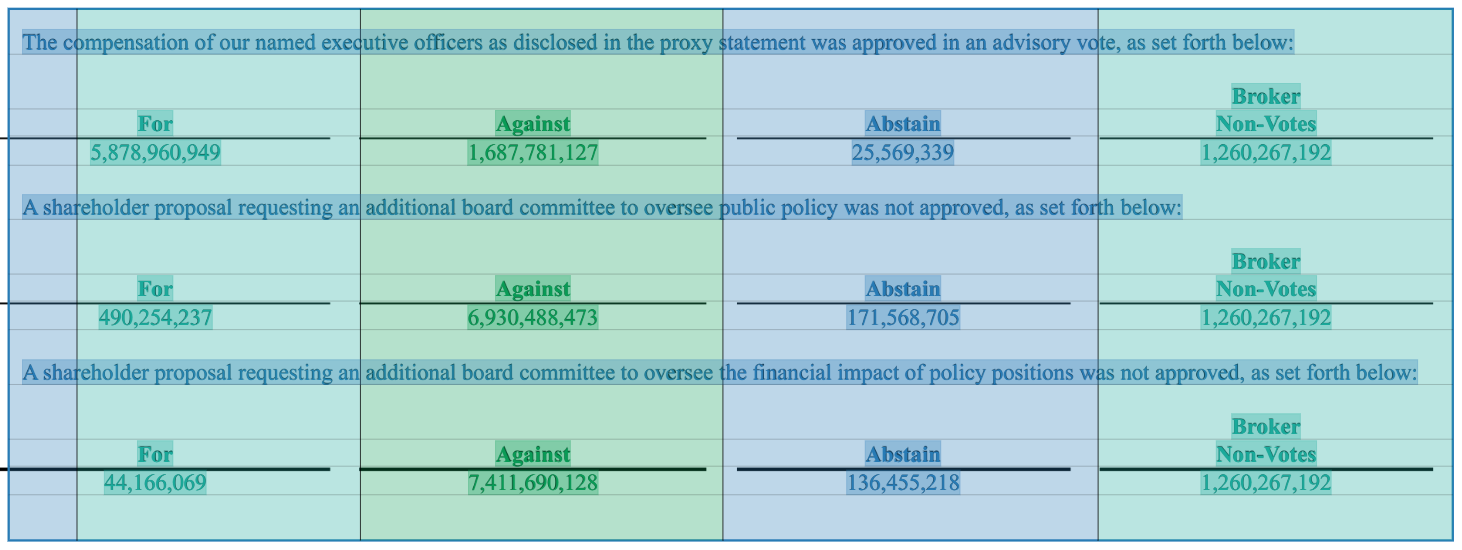
Some tables include single entries that span the width of multiple columns. For example, below is part of a different table from the Amazon 8K filing showing shareholder votes by proposal. The description of each proposal spans the width of all columns.
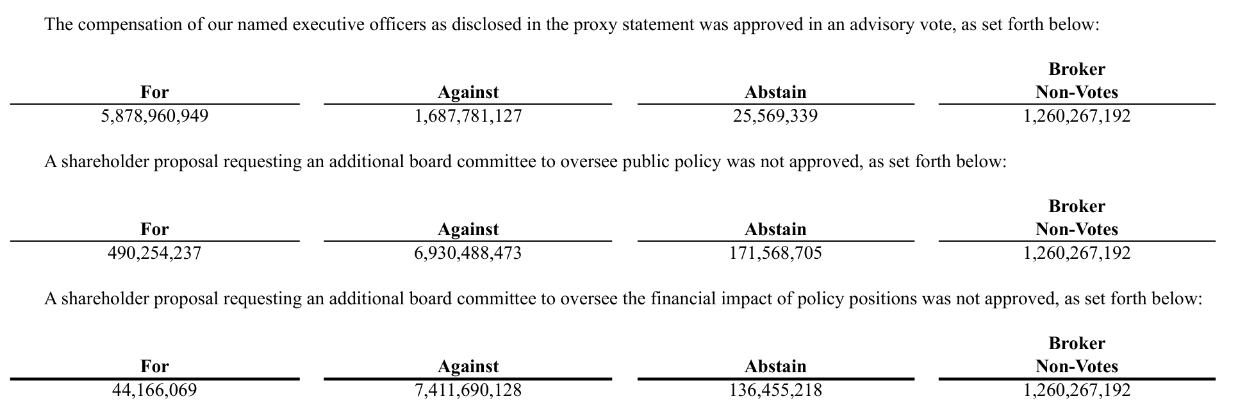
By default, individual words are assigned to the column they overlap the most with. However, this behavior is undesirable in this case, as it results in the proposal descriptions being split up and assigned to the same columns as the vote totals.
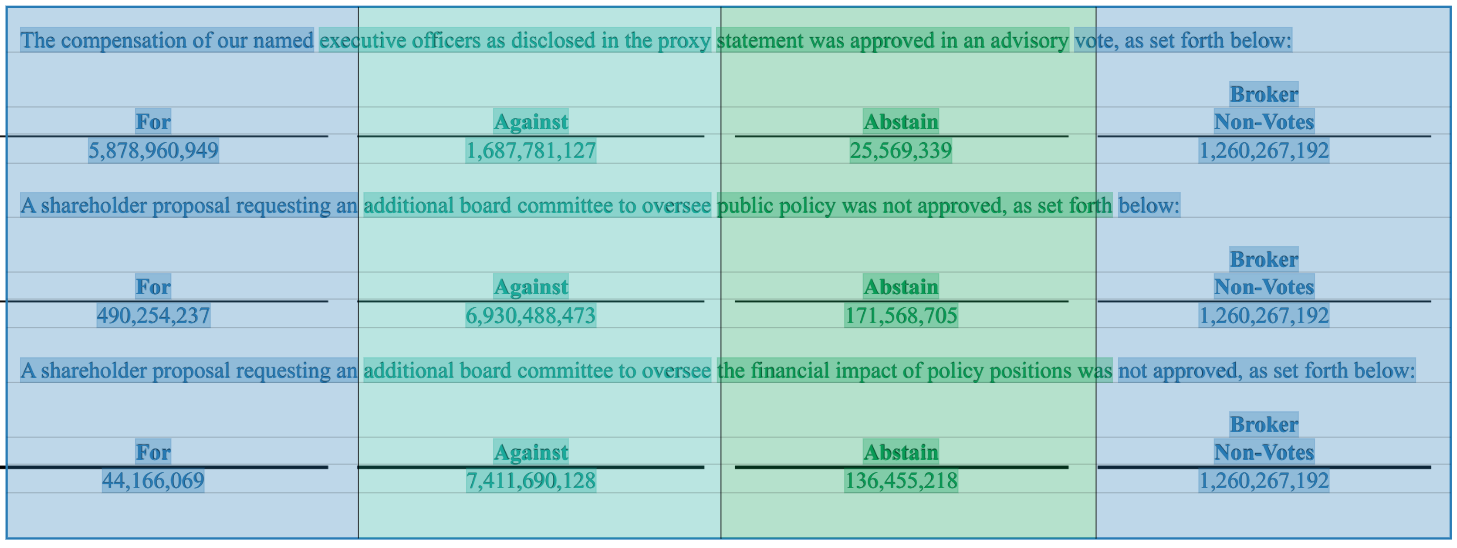
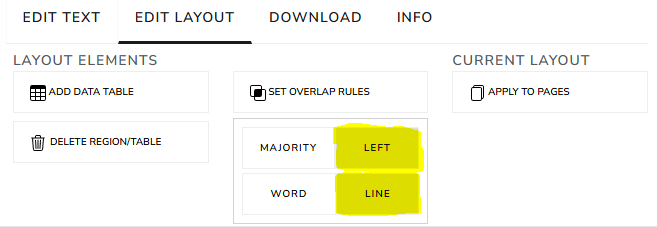
To handle this case, start by creating a new column that includes only the start of the proposal description. Next, select the new column, open the Set Overlap Rules drop-down menu, set the rules to Left and Line. This tells Alch to include all lines where the left bound is inside the selected column.
We can confirm this change worked as expected by checking the viewer. All proposal descriptions are now highlighted the same color as the first column, indicating they are all being assigned to the first column.
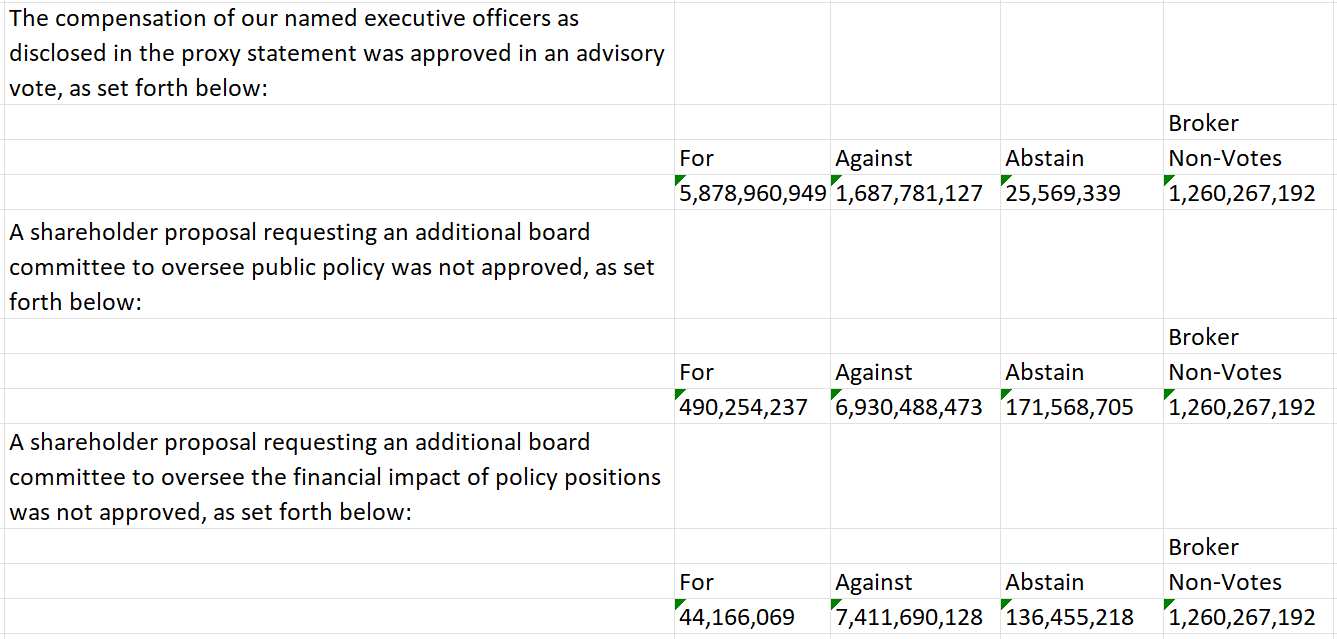
The resulting .xlsx file is shown below. Basic cleaning steps in a program such as Excel, R, or Python can be used to produce a dataset where each row contains a proposal description and vote totals.
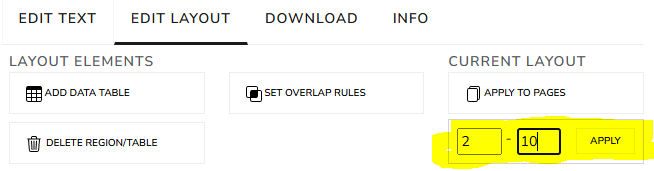
Layouts that Span Multiple Pages
When a single table layout applies to most or all pages within a document, it is not necessary to re-draw the layout on every page. Instead, the current layout can be applied to a page range by clicking Apply To Boxes and setting the desired page range.